Sales Forecasting 101: How to Actually Predict Revenue
Key Takeaways
- CRM stages are lagging indicators. They capture what a rep entered into a system, with no visibility into what the buyer is actually doing. By the time a deal slips its close date, the miss was already weeks in the making.
- No forecasting method survives bad inputs. Before any number goes into the forecast, stress-test your pipeline: flag deals that have gone quiet, close dates already in the past, and late-stage deals running on a single contact.
- Most forecast errors trace back to the same handful of habits: sandbagging, stale close dates, treating same-stage deals as equal. The fix in every case is replacing rep-entered data with signals that reflect what buyers are actually doing.
Every forecast starts as a confident number in a spreadsheet. Then the quarter ends and reality files in: the commit deal that slipped to next year, the “sure thing” that went dark in week three, the pipeline that looked full right up until it didn’t close.
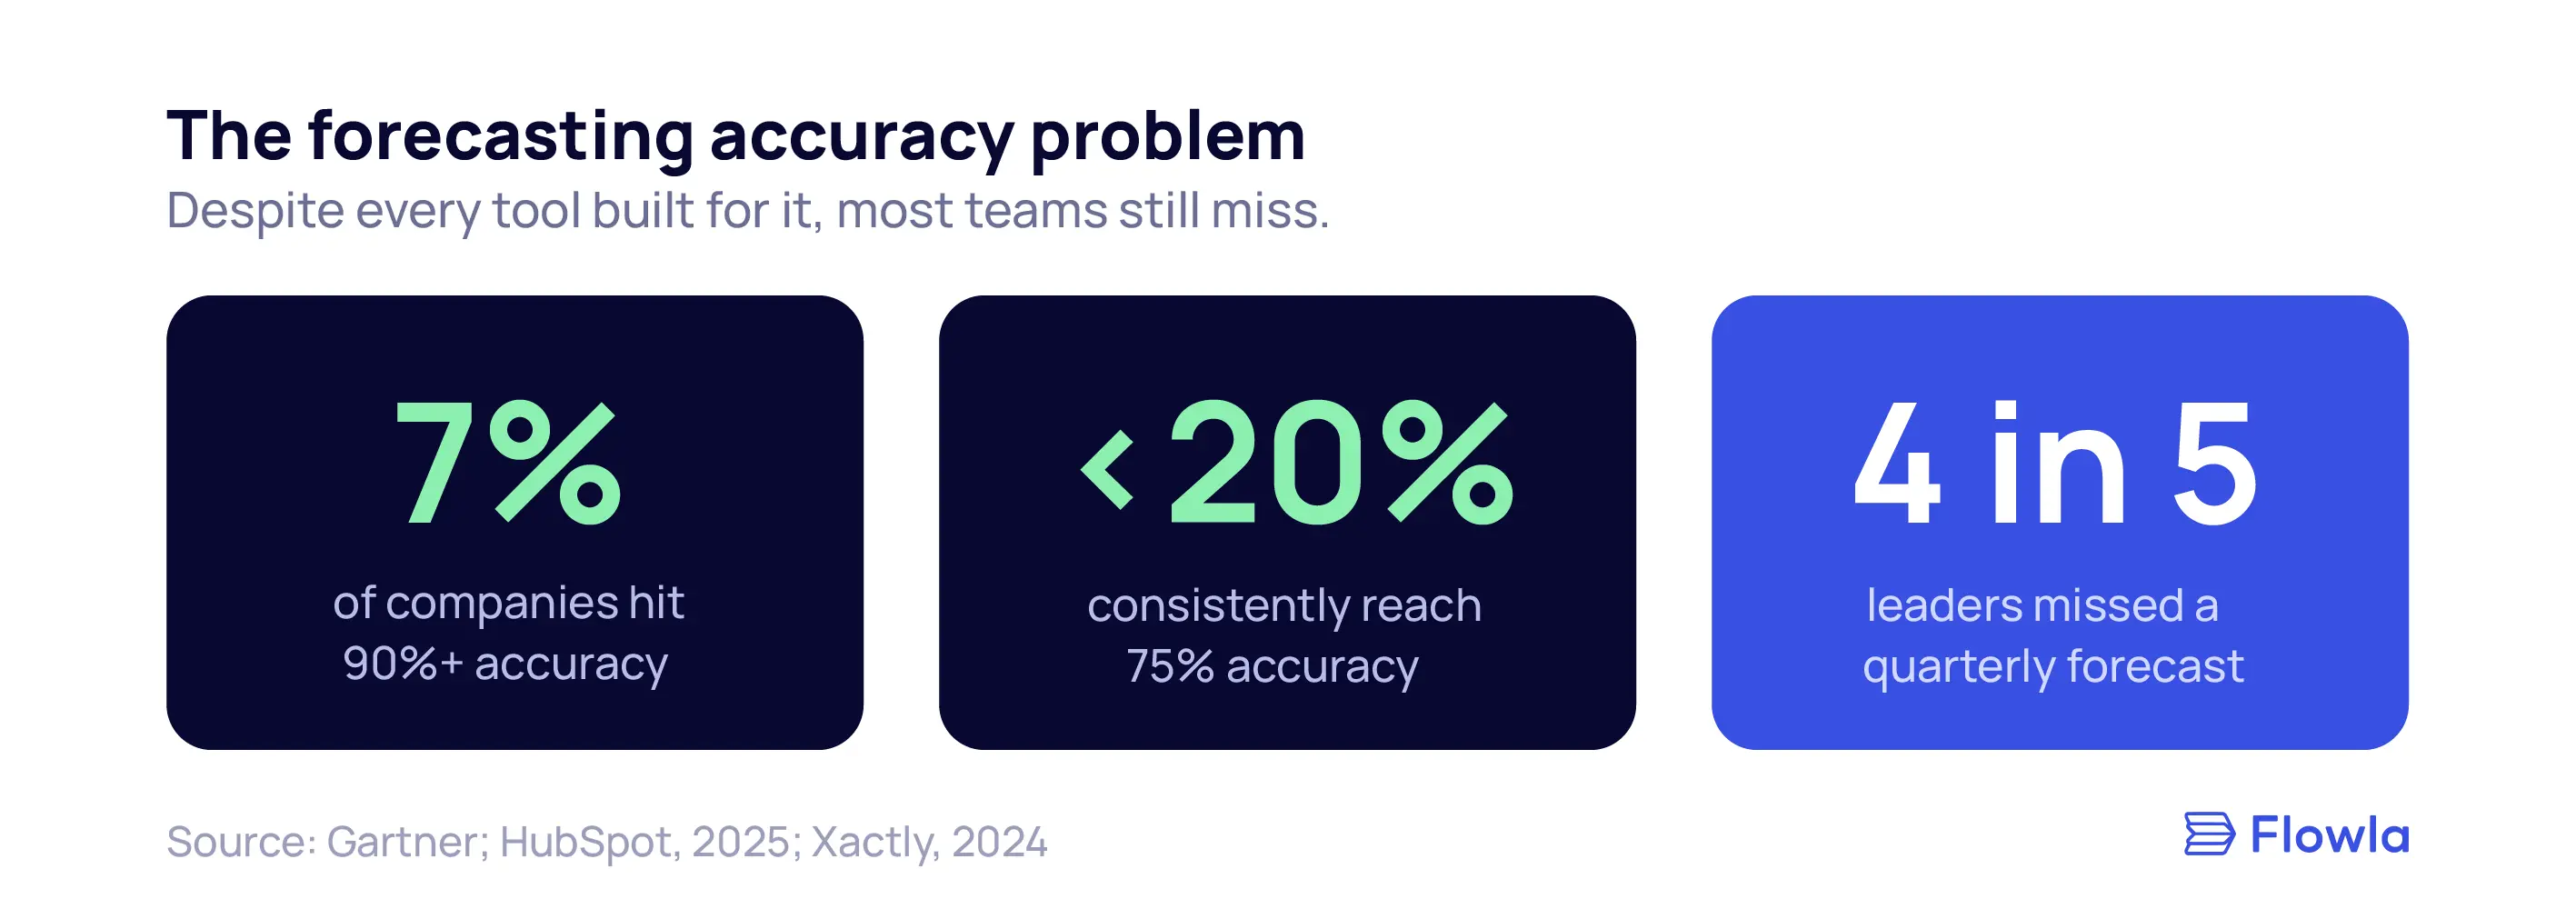
Most sales teams know this feeling. According to Xactly’s 2024 State of Sales Forecasting report, four in five sales and finance leaders missed at least one quarterly forecast last year. Only 7% of companies consistently hit 90% or better accuracy, per Gartner.
The method rarely explains the miss. Bad data going in is almost always the cause.
This guide covers the four main forecasting methods, the specific data quality issue that makes them fail, a worked example of what fixing it looks like, and how to build a forecast that reflects what’s actually happening in your pipeline.
What Sales Forecasting Actually Is
The definition worth keeping
A sales forecast is a data-backed estimate of the revenue your team will close in a given period, based on deals currently in the pipeline and how likely each one is to close.
The concept is simple. The execution is where things fall apart.
A usable forecast pulls from three inputs: historical performance (close rates and cycle lengths by rep, segment, and deal type), current pipeline (deal stages, values, and activity), and known variables (territory changes, hiring, seasonality, pricing shifts). Miss any one and the number drifts.
Forecasting vs. pipeline management
These two get conflated constantly, and that conflation creates real problems.
Pipeline management is about what’s in your funnel: the deals, their stages, the activity against them. Forecasting takes that as input and asks a harder question. Given all of this, what revenue can you actually count on?
A healthy-looking pipeline can produce a terrible forecast. If you have 30 open deals but most of them haven’t had any buyer activity in three weeks, the real forecast is a fraction of the headline number. The two functions feed each other, but they are not the same thing.
Why is sales forecasting important?
Accurate sales forecasting lets businesses plan hiring, budgets, and headcount around expected revenue rather than guesswork. For sales teams, it helps prioritize which deals deserve attention and flags pipeline risk while there’s still time to act. For leadership, a reliable forecast is a credibility signal to the investors and finance teams who depend on it to make capital decisions. Without one, companies over-hire into slow quarters or scramble to close gaps they never saw coming.
The Main Sales Forecasting Methods
1. Historical forecasting
Historical forecasting uses past performance as the baseline. If your team closed $400K last Q3 and nothing major has changed, you forecast something similar for this Q3.
It’s the simplest method and works well for stable businesses with predictable seasonality. The limitation is obvious: it assumes the past reliably predicts the future, which breaks down when team size changes, your ICP shifts, or the market moves.
Formula: Forecast = prior period revenue x (1 + expected growth rate). If you closed $400K last Q3 and you’ve added two reps since, you’d adjust upward from there.
Best for: stable, established businesses running a sanity check against bottom-up pipeline math.
Breaks when: you’ve launched a new product, changed pricing, or reshaped the team, since the past no longer resembles the future.
2. Opportunity stage forecasting
This is the most common method in B2B SaaS. Each deal gets a probability based on its pipeline stage: “Demo held” might be 30%, “Proposal sent” 50%, “Negotiation” 80%. Multiply each deal’s value by its probability and add them up.
Formula: Forecast = sum of (deal value x stage probability) across all open deals. A $40K deal at 50% contributes $20K to the forecast.
The problem (which we’ll come back to) is that stage probabilities reflect your sales process. Buyer behavior never enters the equation. “Proposal sent” means a rep sent something. It says nothing about whether the buyer opened it, shared it internally, or stopped responding.
Best for: most B2B teams that need a grounded, deal-by-deal quarterly number quickly.
Breaks when: stage probabilities are treated as fact rather than estimate, so two deals at the same stage get counted identically even when one is thriving and the other is dead.
3. Length-of-sales-cycle forecasting
This method uses average cycle length to predict when open deals will close. If the typical deal takes 90 days and a specific deal entered the pipeline 75 days ago, you’d weight it heavily for this quarter.
Formula: Expected close date = deal start date + average cycle length. Weight the deal into whichever period that lands in.
It’s more nuanced than stage-based forecasting because it accounts for time. The same flaw applies though: average cycle length assumes a deal is progressing normally. Often, it isn’t.
Best for: teams with 12+ months of clean close-date data and a reasonably consistent cycle.
Breaks when: your cycle length varies widely by segment, or when a deal has stalled but the calendar keeps advancing it toward a close date it will never hit.
4. Multi-variable forecasting
Multi-variable forecasting combines several inputs: deal stage, cycle length, rep close rate, deal size, and sometimes external signals like seasonality or lead source. When implemented well, it’s the most accurate method. It also requires the most data discipline to maintain.
Most companies don’t yet have the CRM hygiene to support this reliably.
Best for: teams with clean data and RevOps support that want the highest accuracy and can maintain the model.
Breaks when: the underlying data is messy, since combining several unreliable inputs produces a confident number built on sand.
Top-down vs. bottom-up: which direction to forecast from
Separate from method choice is direction. Top-down starts with a high-level target (“we need $5M this quarter”) and breaks it down by region, team, or rep. It’s fast and useful for planning, but disconnected from what’s actually in the pipeline.
Bottom-up builds from individual deals upward and is far more grounded, though it inherits whatever optimism your reps baked into their deals. Most teams that forecast well run both and reconcile the gap. When the two numbers are miles apart, that gap is the conversation worth having.
What are the different methods of sales forecasting?
The four main sales forecasting methods are historical forecasting (based on past performance), opportunity stage forecasting (using pipeline stage percentages), length-of-sales-cycle forecasting (predicting close dates from average cycle time), and multi-variable forecasting (combining deal stage, rep performance, engagement signals, and other factors). Most B2B teams use a combination of the first two, though multi-variable tends to be most accurate when underlying data quality is high.
How to pick the right method for your team
- New businesses or limited pipeline history: Start with opportunity stage. It requires the least data infrastructure and gives you a working baseline quickly.
- Growing teams with 12+ months of data: Add length-of-sales-cycle forecasting. It helps you spot deals aging out without any signal they’ll close.
- Teams with clean CRM data and RevOps support: Multi-variable forecasting. The accuracy gains are real, but they only materialize if your inputs are reliable.
Why Most Forecasts Are Still Wrong
Despite every tool and process built around forecasting, only 7% of companies hit 90%+ accuracy (Gartner). Fewer than 20% of B2B sales organizations consistently reach 75% (HubSpot, 2025). Four in five sales and finance leaders say they missed at least one quarterly forecast last year (Xactly, 2024).
The method is rarely the issue. The data going into it almost always is.
The CRM data problem
Only 35% of sales professionals say they fully trust their CRM data (ZoomInfo, 2024). CRM stages reflect what reps enter. Buyer behavior is almost entirely invisible.
A RevOps leader at an enterprise trading software firm described his forecasting process to us plainly. The team pulls reports from Salesforce into a Google Sheet, transforms the data by hand, then asks sales leaders to eyeball whether the numbers look right. “The whole process takes really long and it’s just very manual,” he said. The bigger problem was what the process couldn’t see. Deals sat in the same stage for months, sometimes longer. “I’ve been looking at deals that have been stuck in one stage for years,” he said. And commit deals had a habit of evaporating: “You told us it’s going to close in Q2, and then next week forecasting, it’s like, oh, actually it got pushed to Q3 or Q4. I had a deal last week where it got pushed to next year.”
His point about why cuts to the center of the problem: “We can’t see the granular details. Right now the entire process is the manager goes to the sales rep, asks them manually, hey, how’s the deal going? And the rep comes back, oh, this is what’s happening. The entire process is very manual.” The forecast was only ever as good as a rep’s own read of their own deal, with nothing to check it against.
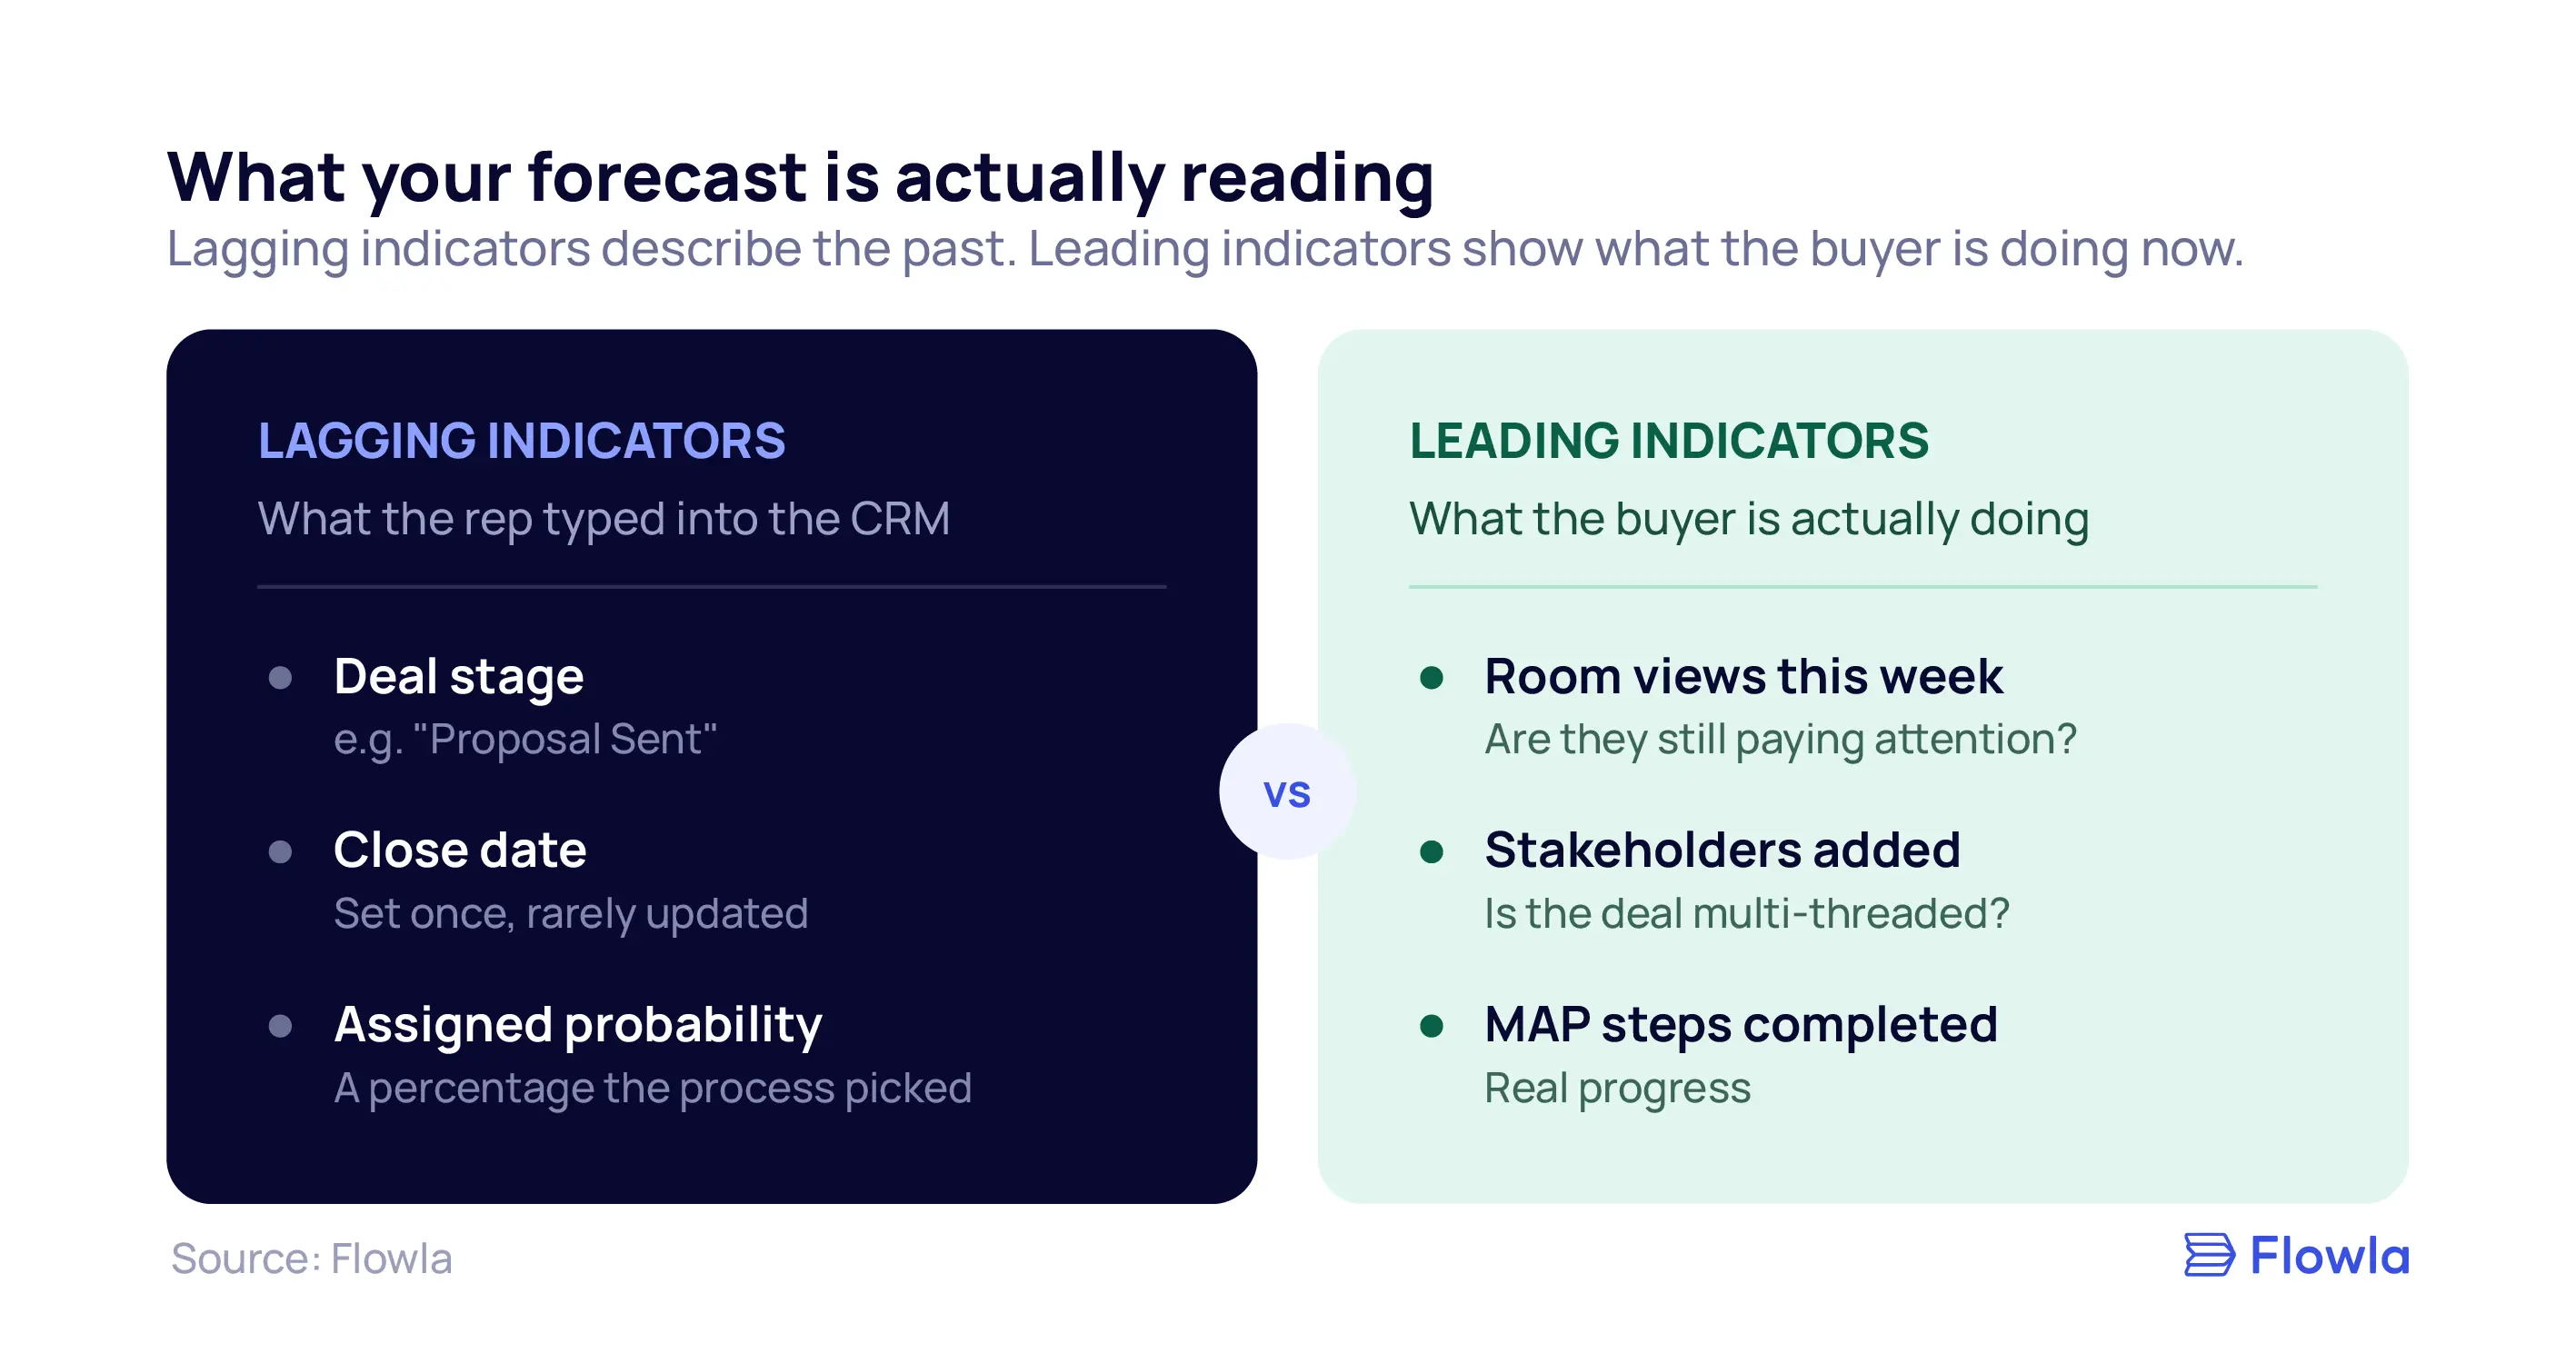
This is the core issue with lagging indicators. Deal stage, close date, and assigned probability tell you what happened in your CRM. They don’t tell you what’s happening on the buyer’s side right now. By the time a deal slips its close date, the miss was baked in weeks earlier.
What buyer engagement signals tell you that stages can’t
A deal room gives you something a CRM stage can’t: visibility into what the buyer is actually doing.
When a buyer returns to a room several times, shares it with new stakeholders, or works through a mutual action plan, those are leading indicators. They show you what the buyer is doing, which is the thing that actually predicts close.
“Proposal Sent” tells you a rep sent something. Deal room data tells you the buyer has viewed the room seven times this week, added their CFO, and completed three of five MAP steps. That’s a very different forecast picture.
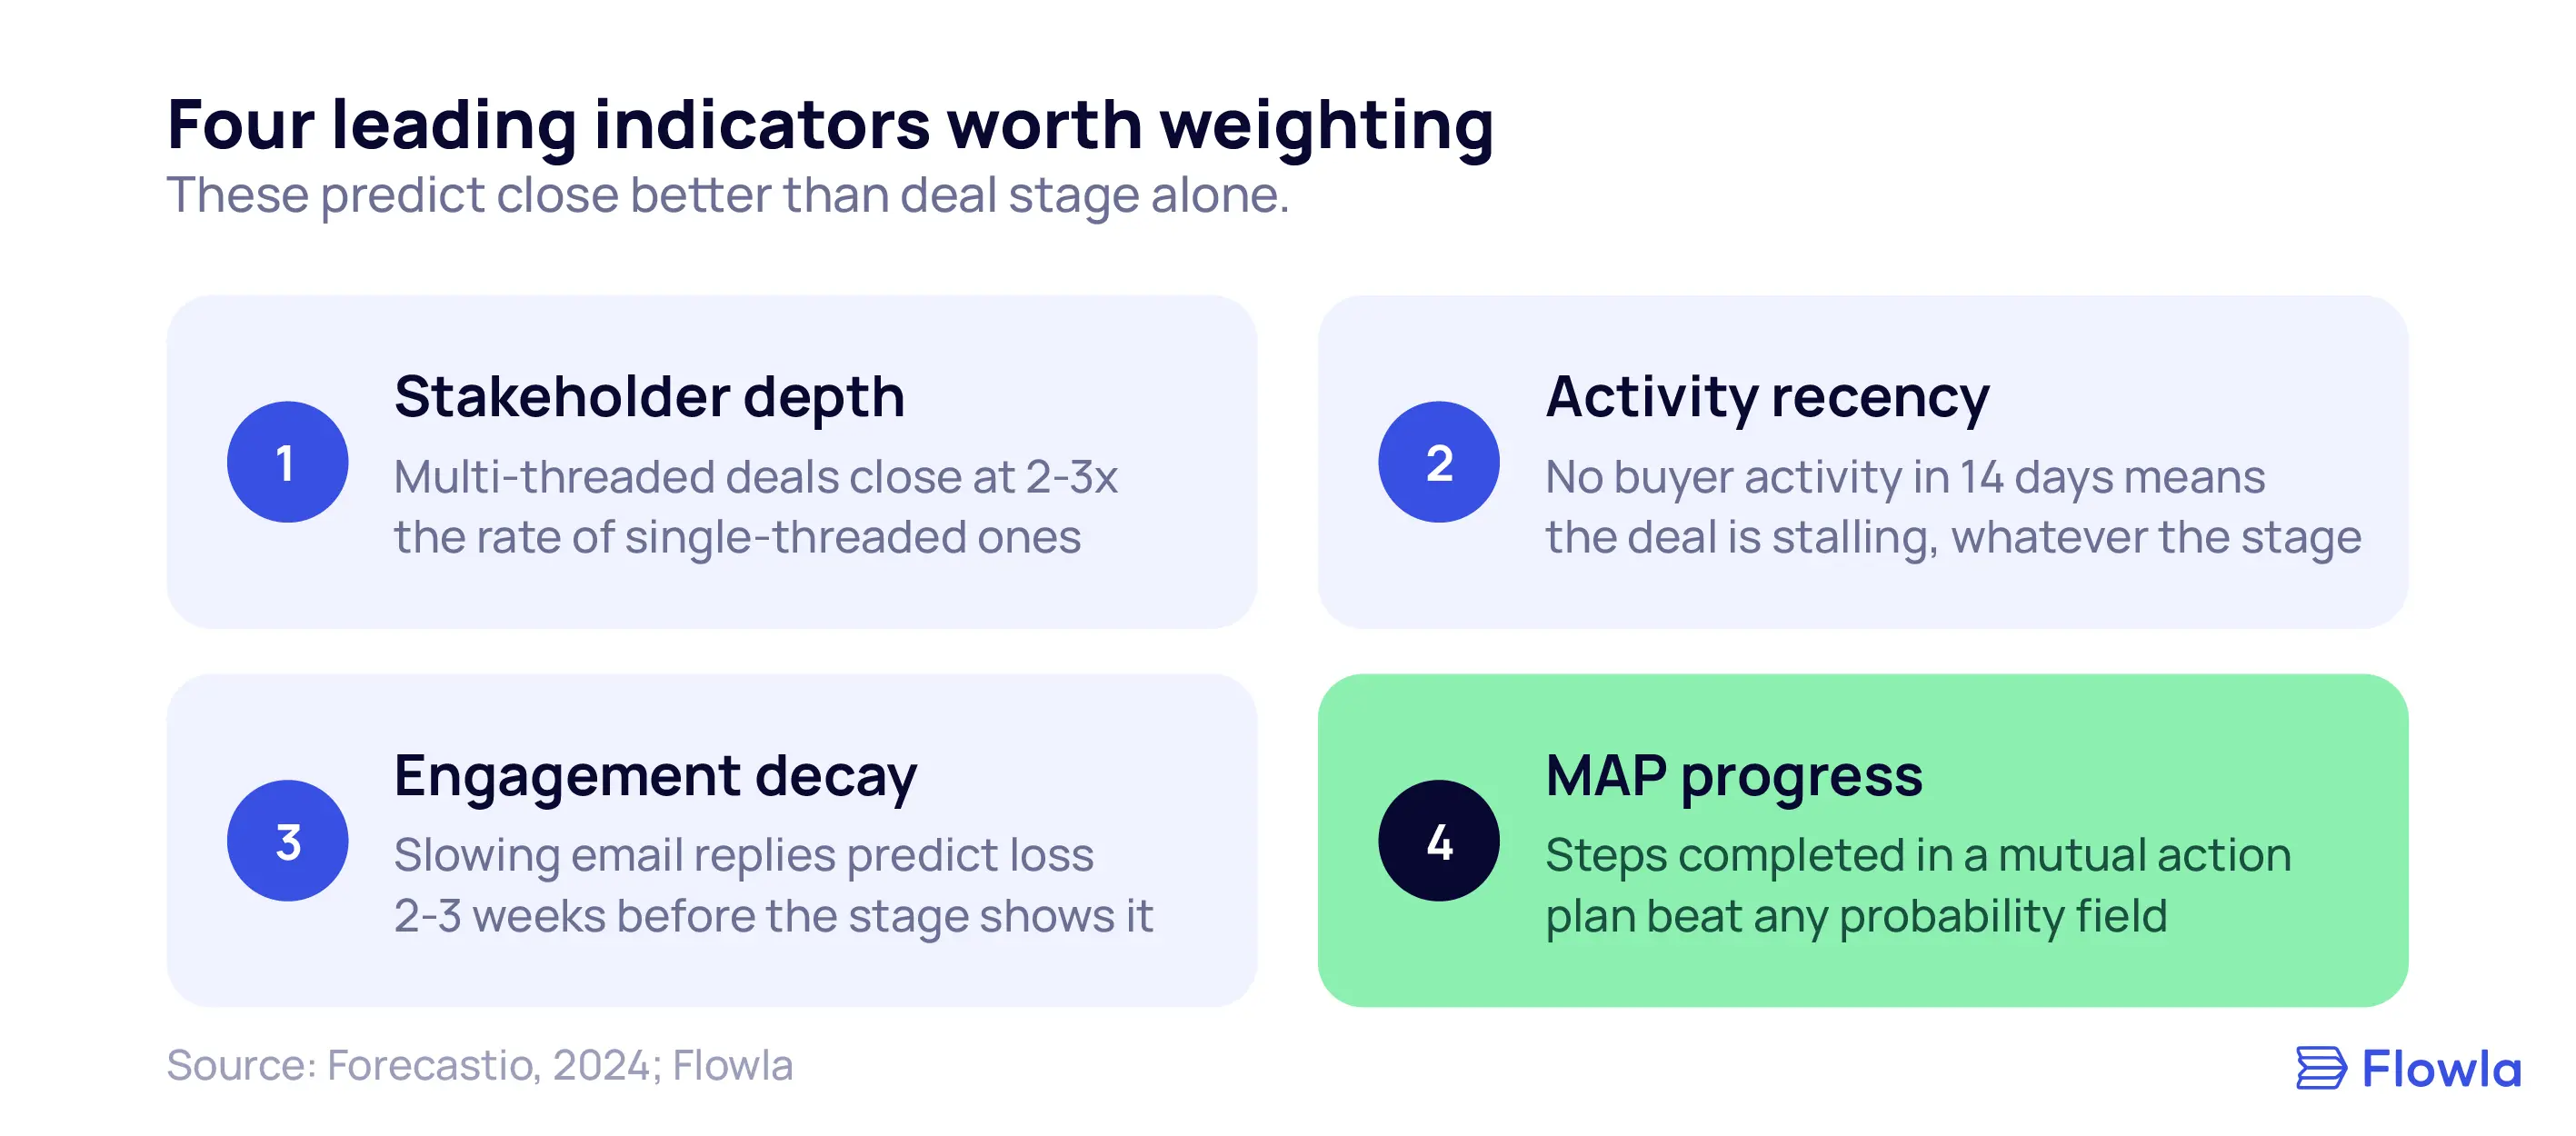
The leading indicators worth weighting your forecast around show up consistently across the research:
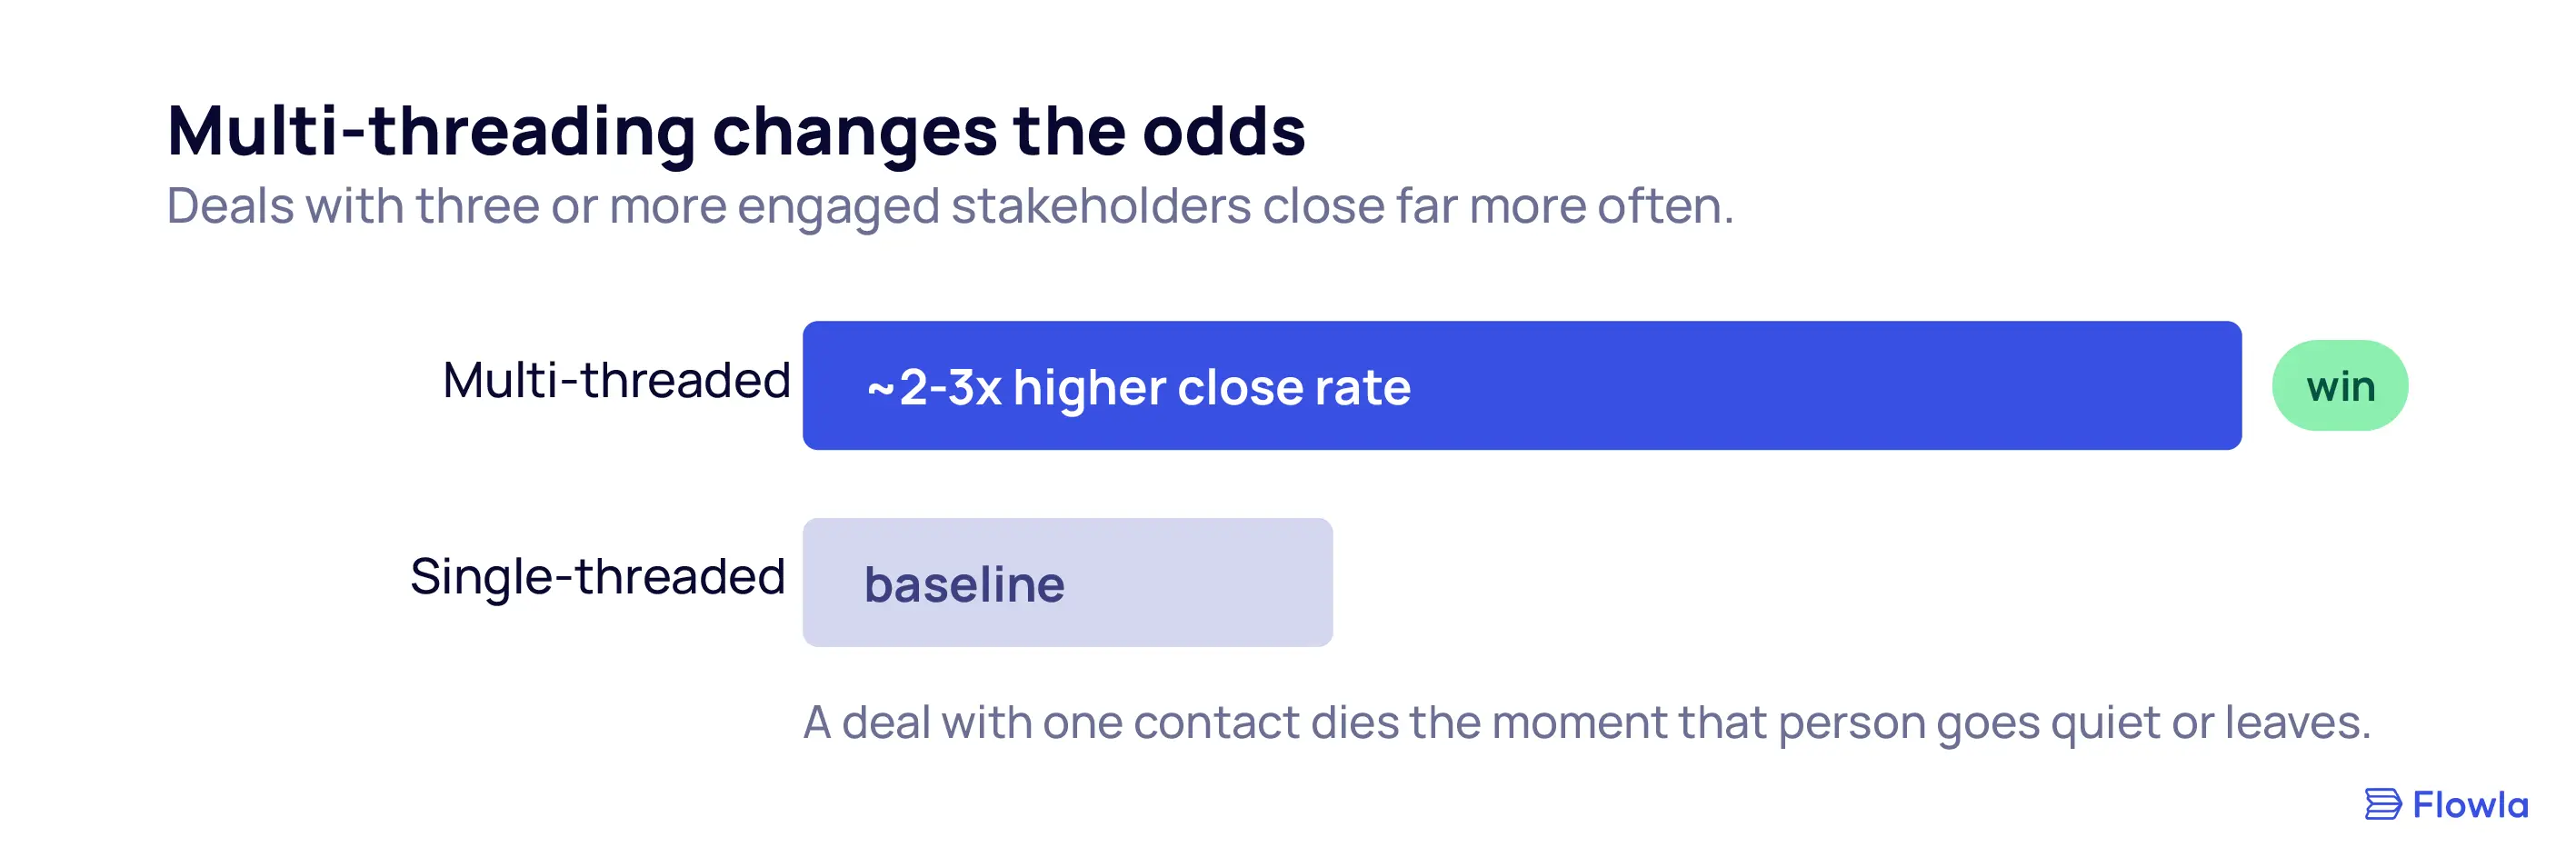
- Stakeholder depth. Multi-threaded deals close at roughly two to three times the rate of single-threaded ones, and closer to three times for enterprise deals (Forecastio, 2024). A deal with one contact is a coin flip you haven’t run yet.
- Activity recency. A deal with no buyer-side activity in the past 14 days is stalling, whatever its stage says. This is your earliest warning.
- Engagement decay. When a buyer’s email replies start slowing down, deal loss tends to follow two to three weeks later, well before it shows up in the stage data.
- MAP progress. A buyer actively completing steps in a mutual action plan tells you more than any probability field.
This is exactly what enterprise teams working complex deals report in practice. In our State of Digital Sales Rooms research, sellers described room activity as their primary deal health indicator: when stakeholders actively engage, deals progress, and when rooms go silent, deals stall. Stakeholder engagement is a leading indicator, and deal rooms surface it in a way CRM entries can’t.
You can read more in our breakdown of how multithreading actually works in sales and CS.
What is a good sales forecast accuracy rate?
A sales forecast accuracy of 80–90% is considered strong for most B2B organizations. The median for B2B SaaS sits between 70–80%. Fewer than 20% of sales teams consistently exceed 75% accuracy. Top-performing teams using prescriptive analytics and weekly pipeline reviews against leading indicators can reach 90%+ consistently. Anything below 70% signals a process or data quality issue worth investigating.
To measure it: Accuracy = 1 − (|Forecast − Actual| / Actual). Forecast $1M, close $900K, and you’re at 90% accuracy. Track it quarterly and by segment so you can see which parts of the pipeline you consistently misread.
A Worked Example: The Same Pipeline, Two Forecasts
The fastest way to see why leading indicators matter is to forecast the same pipeline twice. Once the way most teams do it, using stage probability alone. Then again, weighted by what the buyers are actually doing.
Here’s a simplified Q3 pipeline of five deals, each with its stage-based probability:
- Deal A, $80K, Negotiation (80%) = $64K
- Deal B, $120K, Proposal Sent (50%) = $60K
- Deal C, $50K, Proposal Sent (50%) = $25K
- Deal D, $200K, Demo Held (30%) = $60K
- Deal E, $90K, Negotiation (80%) = $72K
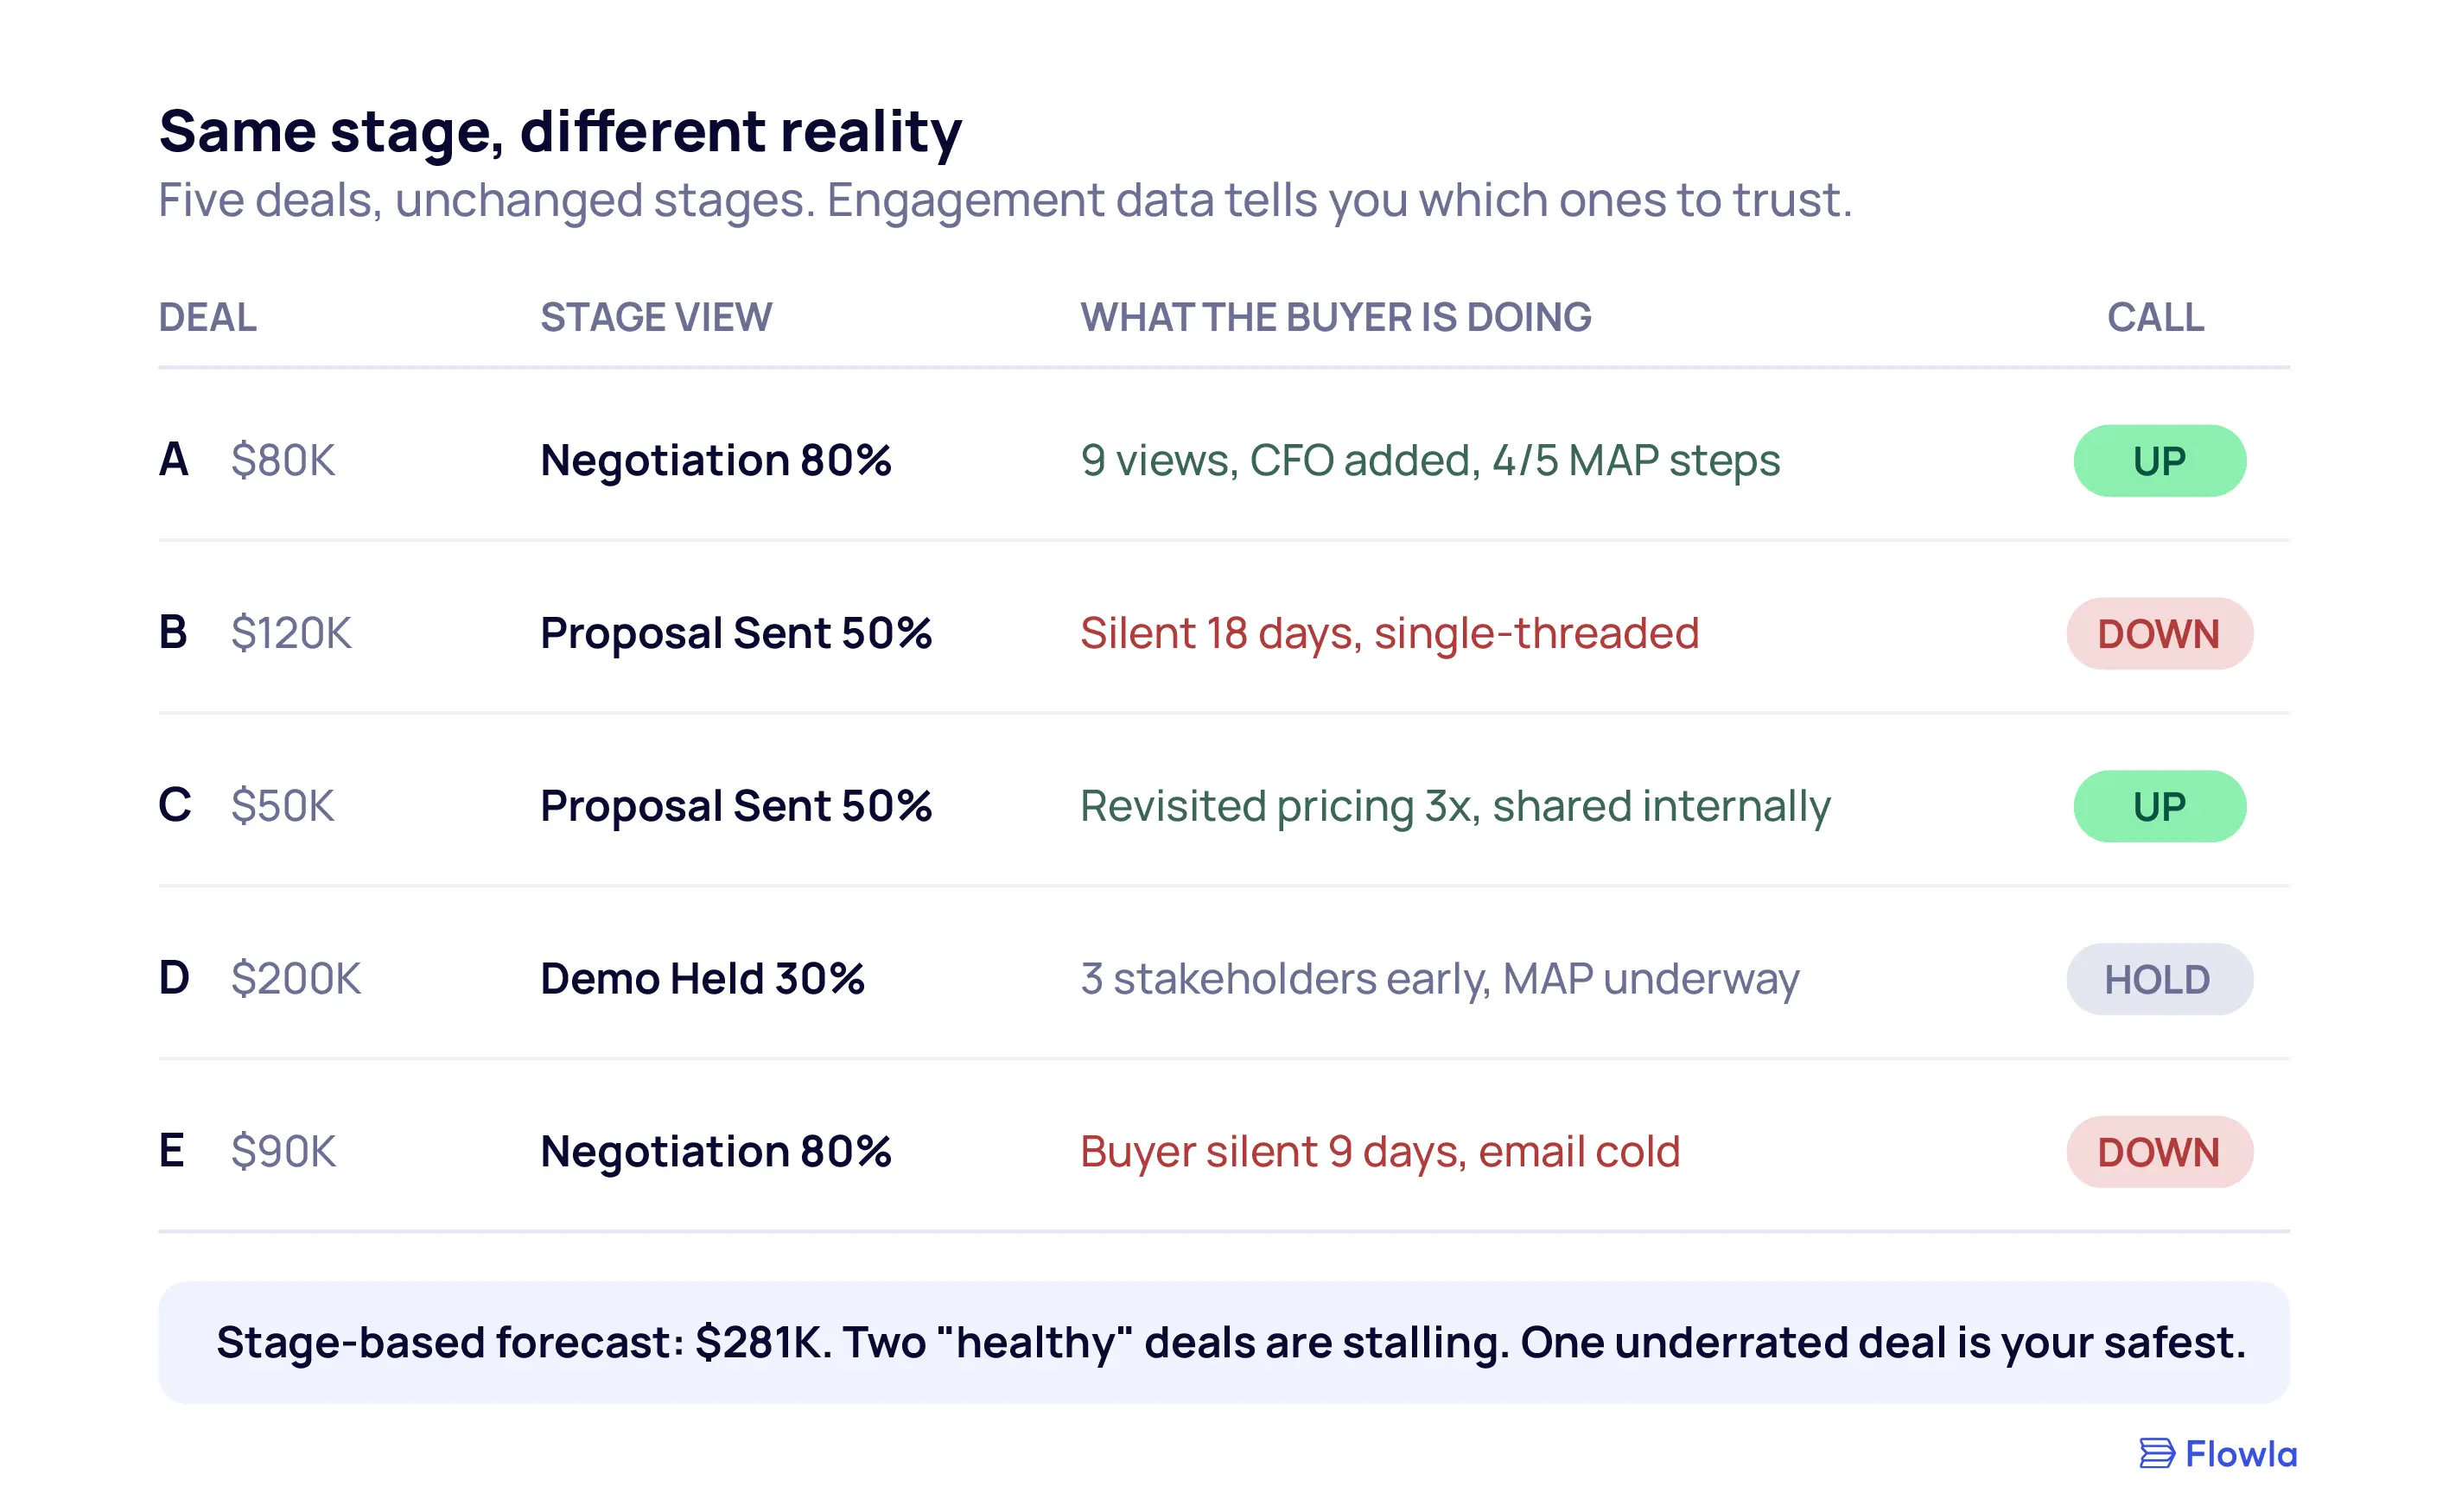
Add those up and the stage-based forecast is $281K. It looks clean and confident, and it’s almost certainly wrong, because every number rests on a stage label a rep chose.
Now layer in the engagement data from the deal rooms:
- Deal A ($80K, Negotiation): Buyer viewed the room 9 times this week, added their CFO and a procurement lead, completed 4 of 5 MAP steps. Three stakeholders engaged. Everything points the right way. Weight up.
- Deal B ($120K, Proposal Sent): No room activity in 18 days. Single-threaded to one champion who has gone quiet. The stage says 50%, but the behavior says stalled. Weight down hard.
- Deal C ($50K, Proposal Sent): Buyer revisited the pricing page three times in two days and forwarded the room internally. Same stage as Deal B, completely different reality. Weight up.
- Deal D ($200K, Demo Held): Early stage, but already three stakeholders in the room and a MAP underway. Unusually strong for its stage. Hold, watch closely.
- Deal E ($90K, Negotiation): Looks healthy on paper, but the economic buyer hasn’t opened the room in nine days and stopped responding to email six days ago. Late-stage deals that go quiet are the most dangerous kind. Weight down.
Nothing about the deals changed between the two passes. Same values, same stages, same reps. All that changed is that the second pass looks at what the buyers are doing. And that alone flips the picture: Deal B and Deal E are far shakier than their stages suggest, while Deal C is stronger than its label. The headline number moves. More usefully, you now know which two deals to intervene on this week instead of finding out at quarter close.
Stage tells you where a rep put the deal. Engagement tells you where the buyer actually is.
How to Build a Sales Forecast From Scratch
To build a sales forecast, start by defining your time period and revenue target. Choose a forecasting method that fits your data maturity. Pull all open deals from your pipeline and assign close probabilities. Stress-test those probabilities against actual buyer engagement. Stage labels alone won’t hold up. Then review weekly and adjust based on what’s actively changing in your live deals.
Step 1: Define your time period and revenue target
Start with cadence, because it decides everything downstream. The right forecast period is tied to your sales cycle length, not the calendar.
If your average deal closes in under 30 days (most SMB and transactional motions), forecast monthly with pipeline reviews every week. A quarter is too coarse to catch a problem in time. If your cycle runs 60 to 120 days (typical mid-market and enterprise B2B SaaS), forecast quarterly with a weekly forecast call that rolls up to the quarter number. This is the default for most B2B teams, since it lines up with board reporting and quota periods. If you’re early-stage with fewer than 20 or 30 closed deals total, don’t try to forecast a precise number at all yet. Track pipeline coverage (total open pipeline divided by target) and lean on your win rate as it stabilizes.
Then anchor the forecast to a target. What does the business need to close this period to stay on plan? That number tells you how much pipeline coverage you need. A common rule of thumb is 3x to 4x coverage, meaning if you need to close $500K, you want $1.5M to $2M of qualified pipeline in the period. If you’re short of that going in, the forecast conversation is really a pipeline-generation conversation, and better to have it now than in week 11.
Step 2: Choose your method
Match the method to the data you actually have, not the one that looks most sophisticated.
If your pipeline history is thin, use opportunity stage forecasting: assign each deal a probability based on its stage, multiply by deal value, and sum. It’s the fastest way to a working baseline and needs almost no historical data.
Once you have 12+ months of clean close-date data, layer in length-of-sales-cycle forecasting to catch deals that are aging past their expected close without any sign of movement. If you have clean data and RevOps support, multi-variable forecasting (stage, cycle length, rep close rate, deal size, engagement) is the most accurate option, though only if you can keep the inputs clean.
Most teams land on a blend: stage-based math for the quarter number, historical trends as a sanity check against it. Don’t over-engineer the method before your data is ready to support it. A precise-looking model built on messy inputs is just a slower way to be wrong.
Step 3: Pull your pipeline data and stress-test it
Pull every open deal expected to close in the period. Before you trust a single probability, run the pipeline through a few hard questions:
- Which deals have gone quiet? Flag anything with no buyer-side activity in the past 14 days. A deal with no recent engagement has a much lower real close probability than its stage suggests. Remove these from your committed number or weight them down sharply.
- Which close dates are already in the past? Pushed deals that never got re-dated are a top source of forecast error. Either give them a new date with a reason, or move them out of the period.
- Which deals are single-threaded? A late-stage deal with only one contact is a risk regardless of how confident the rep is, because the deal dies the moment that person goes quiet or leaves.
- Which deals are missing qualification basics? If you run MEDDIC or a similar framework, check that committed deals actually have an identified economic buyer, a confirmed budget, and a real timeline. A $200K deal in late stage with no known decision-maker deserves scrutiny, not a spot in the commit.
The goal here is to separate the pipeline that looks real from the pipeline that is real, before either goes into the forecast.
Step 4: Weight deals by actual engagement
Instead of relying on stage probability alone, layer in buyer engagement data. Which deals have had new stakeholders added? Which rooms are being actively revisited? Which mutual action plans show real progress? Weight those deals up. Push down the ones where all the visible activity is coming from the seller’s side.
In practice this looks like adjusting the stage probability up or down based on behavior. Take two deals both sitting at “Proposal Sent, 50%.” One has had the buyer back in the room four times this week with the CFO newly added. You might weight that to 70%. The other has been silent for three weeks and is single-threaded to one contact. That one drops to 25%, whatever the stage says. The stage sets the starting point. The engagement data corrects it toward reality.
If you’re building a multithreading motion into your process, this step also gives you a way to track how deep your buyer-side coverage actually runs. Embedding a live mutual action plan in each deal is what gives you something concrete to measure, since progress through it is a signal in itself.
Step 5: Review and adjust weekly
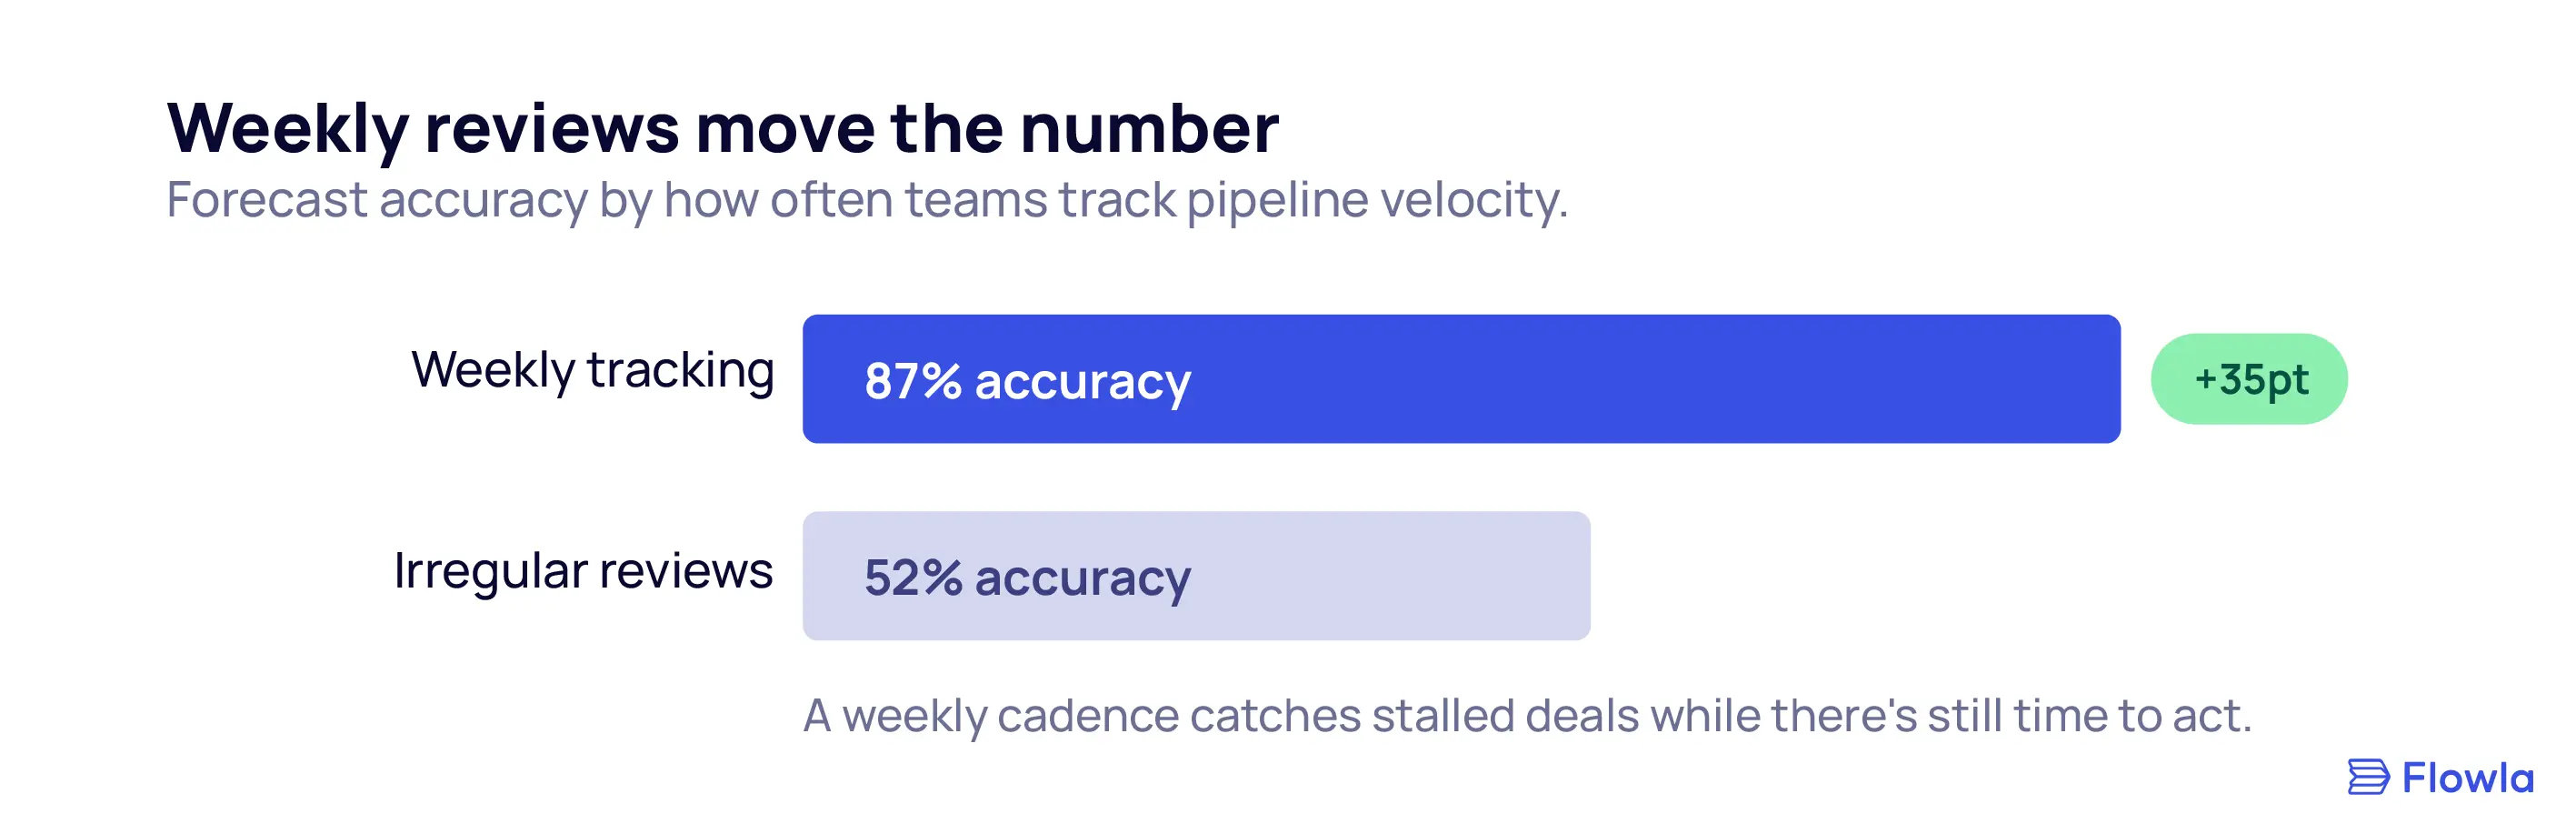
A forecast is only useful if it stays current. Teams that track pipeline velocity weekly achieve 87% forecast accuracy on average, compared to 52% for those who review irregularly (Digital Bloom, 2025).
Build the weekly review into your team’s rhythm. Think of it as calibration, not reporting.
A useful weekly review isn’t a status meeting where reps recite what they told you last week. It’s a working session on what changed: which deals moved stages, which went quiet, which had new stakeholders appear, which slipped their date. For each at-risk deal, the output is an action, not a note. “Champion has gone dark, so we re-engage through the VP we met in the room” is a review doing its job.
One addition worth making: run three versions. A commit case (deals you’d bet on), a best case (everything breaks your way), and a worst case (only what’s already deeply engaged). A single number invites false confidence. A range tells leadership what’s actually at stake and where. The spread between your best and worst case is itself a signal: a wide gap points to pipeline quality problems, volume aside.
Common Forecasting Mistakes (and How to Fix Them)
Most forecast error traces back to a handful of predictable habits, and nearly all of them share the same root cause: trusting what was entered over what’s actually happening.
Rep sandbagging and happy ears
Reps are optimistic by nature and training. Left to gut feel, some inflate their commit to look good and others lowball to beat expectations later. Most overweight their most recent conversation and underweight structural signals like deal age and stakeholder count. Rep judgment is the single biggest source of forecast error.
The fix: Give rep calls something objective to sit against. Define what qualifies as “commit” versus “best case” using deal stage, activity recency, and engagement data rather than confidence. Then build a deal score from those measurable signals and use it to weight the rep’s call. The goal is to add objectivity, not eliminate judgment. When a rep says a quiet, single-threaded deal is a commit, the data gives you grounds to ask why.
Stale close dates that never get updated
Pushed deals that no one updates are one of the most common sources of forecast error. A deal with a close date three weeks in the past is still sitting in someone’s current-quarter number. The RevOps leader we spoke to watched commit deals slip from Q2 to Q4 to next year precisely because nothing forced that reckoning until forecast day.
The fix: Every week, flag deals whose close date has passed or whose age now exceeds your average cycle length. Either re-date them with a documented reason, or move them out of the committed forecast entirely. No deal keeps its commit status on a date that has already come and gone.
Treating two same-stage deals as equal
Two deals sitting in “Negotiation” are almost never equal. One has four engaged stakeholders, a confirmed budget, and an active mutual action plan. The other has a single contact who went dark last week. Pure stage-weighted forecasting counts them the same, which is how a confident forecast quietly fills up with dead pipeline.
The fix: Score deals individually on engagement and recency so your model can tell the two apart. Two deals at the same stage should carry different weights when one is active and multi-threaded and the other has gone silent.
Forecasting on a cycle time that no longer exists
B2B sales cycles have lengthened by roughly 22% since 2022 (Digital Bloom, 2025), and buying committees have grown to 6 to 10 people (Gartner). A model calibrated to 2021 velocity runs systematically optimistic, expecting deals to close in a quarter that now realistically takes longer.
The fix: Recalibrate cycle length by segment at least quarterly, and segment it by deal size instead of pooling everything into one average. An SMB deal and a six-figure enterprise deal do not move at the same speed, and a blended average hides that.
Running the same broken process every quarter
The difference between a forecast that improves and one that stays stuck at 70% accuracy is the post-quarter review. Most teams note the miss, adjust next quarter’s target, and run the exact same process again.
The fix: After each quarter, answer three questions. Which deals did you forecast that didn’t close, and why? Which closed that you didn’t forecast, and why? And what will you change in the methodology as a result? The third question is the one most teams skip, and it’s the only one that actually moves accuracy over time.
FAQ
What is the difference between a sales forecast and a sales goal?
A sales goal is a target your team is trying to hit. A sales forecast is a prediction of what your team will likely close based on current pipeline data. Goals are aspirational; forecasts should be as accurate as possible regardless of whether the number looks good. Conflating the two is one of the most common reasons forecasts get padded with wishful thinking rather than grounded in what’s actually in the pipeline.
What are the different methods of sales forecasting?
The four main sales forecasting methods are historical forecasting (based on past performance), opportunity stage forecasting (using pipeline stage percentages), length-of-sales-cycle forecasting (predicting close dates from average cycle time), and multi-variable forecasting (combining deal stage, rep performance, engagement signals, and other factors). Most B2B teams use a combination of the first two, though multi-variable tends to be most accurate when underlying data quality is high.
How do you improve forecast accuracy?
Start by auditing your CRM data quality. Missing fields and stale close dates are the most common root causes of inaccuracy. Then add leading indicators: buyer engagement activity, stakeholder additions, and mutual action plan progress. Teams that review pipeline weekly using actual buyer signals consistently outperform those relying on rep-submitted stage data alone.
How often should you update your sales forecast?
Most high-performing B2B teams update their forecast weekly. Monthly reviews accumulate too much error before they’re corrected. A weekly cadence lets you catch stalled deals before they blow up a quarter. If your average cycle is under 60 days, weekly is the minimum.
What tools do sales teams use for forecasting?
CRM platforms like HubSpot, Salesforce, and Pipedrive provide the foundation. Revenue intelligence tools like Gong and Clari add call and activity data. Deal rooms like Flowla add the buyer-side layer: who opened the room, who got added as a stakeholder, and how far a mutual action plan has progressed. The most reliable setups run all three together, so the forecast reflects both what reps did and what buyers are actually doing.
Turn buyer engagement into forecast confidence
Flowla shows your team in real time how buyers interact with every deal room, so your forecast reflects what buyers are doing and not just what reps typed into the CRM.
Book a demoRecommended for you


Want to discover Flowla?
Book a 15-minute chat with a product expert. We'll walk you through every step of the way as you get set up.
.webp)
.webp)
.webp)
.webp)
.webp)